
End-User Experience Monitoring
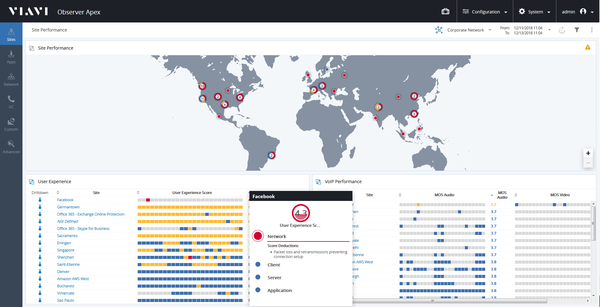
Powerful machine learning delivers real-time insight into how users experience applications and services with a single, color-coded score and easy-to-understand domain breakouts for fast troubleshooting.
Gain Actionable Insight into End-User Satisfaction
Knowing whether users of IT are happy with service delivery is the ultimate arbiter of customer fulfillment. Until recently this was difficult for IT teams to assess without deploying complex and costly agents on each user device. Too much time has been spent chasing red performance indicators without truly understanding if it’s impacting business or end users. Observer solves this dilemma with multi-dimensional End-User Experience Scoring using wire data and the power of machine learning.
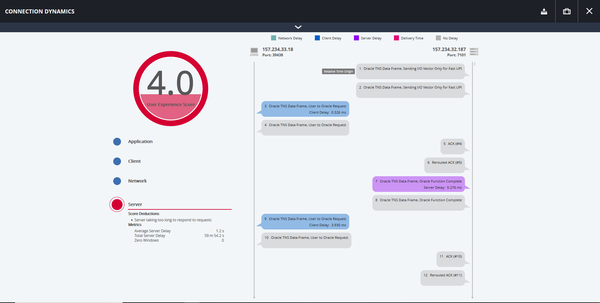
VIAVI End-User Experience Scoring eliminates the guesswork and manual sleuthing from performance monitoring, automating the process by scoring every transaction and isolating problems to the network, application, server or client domain.
Introducing Observer v18 and GigaStor Gen 4
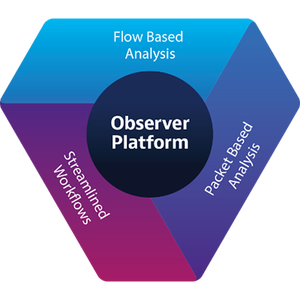
Now, with the release of Observer v18, packet and enriched flow data now coexist in Observer Apex. This single, integrated interface improves operational efficiencies through boosted data quality, intuitive visualizations, and simplified workflows for any level of IT user.
With GigaStor Gen 4, VIAVI also delivers the fastest independently validated wire data appliance with over 60 Gbps capture speeds, ensuring that End-User Experience scoring gives you the most complete picture of your network
IT Operational Clarity, Not KPI Clutter
IT teams need comprehensive visibility into service health and answers to troubleshooting problems, not end-less lists of KPIs. Data without direction is meaningless, that’s why VIAVI Observer now offers multi-dimensional End-User Experiencing Scoring. Designed to eliminate the headache of understanding which users are impacted and why, it does the heavy lifting by performing advanced analytics of numerous operational variables.
Calculated in real-time and retained over extended periods, End-User Experience Scoring reports on every single transaction in an easy-to-visualize numeric value red (critical), yellow (warning), and blue (good) color grading schema from zero to ten. Each score is then further broken out by associated domain: server, application, client, and network-application.
Available at the individual user level, scores are also intelligently rolled-up so IT teams can quickly assess if the anomaly is impacting one or multiple users at the site level. Learn more about this patent pending technology here.